Introduction
Fully functional and reliable automated “AI” grading of essays is a long way off yet and well beyond the computing capability available in typical secondary school classrooms. However, useful steps in that direction are well within reach, particularly for working within the domain of limited vocabulary and composition skills that constitute the typical proficiency level of students in grades six through twelve. High school social studies teachers in New York State assess student essays using a grading rubric provided by the State Education Department. One dimension of this rubric is to assess the relative degree of “analytic writing” versus descriptive. Students whose essays are more analytical than descriptive have a work of greater value. The artificially intelligent grading program at InnovationAssessments.com estimates the grade of a student writing sample by comparing it to a number of models in a corpus of full credit samples. With a view to developing an algorithm that better imitates human raters, this paper outlines the data and methods underlying an algorithm that yields an assessment of the “richness of analysis” of a student writing sample.
Measuring “Richness” of Analysis in Secondary Student Writing Samples
The New York State generic scoring rubrics for high school social studies Regents exams, both for thematic and document-based essay1, value student expository work where the piece “[i]s more analytical than descriptive (analyzes, evaluates, and/or creates* information)” (Abrams, 2004). A footnote in the Generic Grading Rubric states: “The term create as used by Anderson/Krathwohl, et al. in their 2001 revision of Bloom’s Taxonomy of Educational Objectives refers to the highest level of the cognitive domain. This usage of create is similar to Bloom’s use of the term synthesis. Creating implies an insightful reorganization of information into a new pattern or whole. While a level 5 paper will contain analysis and/or evaluation of information, a very strong paper may also include examples of creating information as defined by Anderson and Krathwohl.”
Anderson and Krathwohl (2002), in their revision of Bloom’s Taxonomy, define analysis thus:
4.0 Analyze – Breaking material into its constituent parts and detecting how the parts
relate to one another and to an overall structure or purpose.
4.1 Differentiating
4.2 Organizing
4.3 Attributing
One of the ways that students analyze is to express cause and effect relationships (Anderson and Krathwohl’s “4.3 Attributing”). It is possible using natural language processing techniques to identify and examine cause and effect relationships in writing samples using lexical and syntactic indicators. Taking a cue from the New York State rubric, one could judge that a student writing sample is more “richly analytical” if it “spends” more words on cause and effect proportionate to the entire body of words written.
Identifying and Extracting Cause and Effect Relationships using Natural Language Processing
With regard to identifying cause-effect relationships in natural language, Asghar (2016, p. 2) notes that “[t]he existing literature on causal relation extraction falls into two broad categories: 1) approaches that employ linguistic, syntactic and semantic pattern matching only, and 2) techniques based on statistical methods and machine learning.” The former method was selected for this task because the domain is limited to secondary level student writing samples and they use a limited variety of writing structures. Previous work studying this issue yielded better results in domain-specific contexts (Asghar, 2016) and tagging sentences containing cause-effect relationships in this context should be within reach to a high degree of accuracy.
The software is written in Perl. The following process is applied to the student writing sample for
analysis:
- The text is “scrubbed” of extra consecutive spaces, HTML tags, and characters outside the normal alphanumeric ASCII range.
- The Flesch-Kincaid text complexity measure is calculated.
- The text is “lemmatized”, meaning words that have many variations are reduced to a root form (i.e., “is, am, are, were, was” etc. are all turned to “be”; “cause, caused, causing” etc. are all turned to “cause.”)
- The text is “synonymized”, meaning words are changed to a single common synonym. The text is separated into an array of sentences and all words are tagged by their part of speech.
- A variety of lexical and syntactic indicators of cause-effect are used in pattern matching to identify and extract sentences which include a cause-effect relationship into an array.
- The resulting array of cause-effect relationship sentences are converted into a “bag of words2” without punctuation. Stop words are removed. All words are “stemmed”, meaning variations on spelling are removed.
- Finally, both the original text and the array of cause-effect relationships are reduced further to a bag of unique words.
At this point, the computer program compares the bags of words. The resulting percentage is the proportion of unique words spent on cause-effect out of the total number of unique words. Recall that these are “bags of words” which have been lemmatized, synonymized, stemmed, and from which stop words have been removed.
Limitations of this Method
There are ways to express cause-effect relationships in English without using lexical indicators such as “because”, “thus”, “as”, etc. For example, one could express cause and effect this way: It was raining very heavily. We put on the windshield wipers and we drove slowly.
“Putting on the wipers” and “driving slowly” are caused by the heavy rain. There are no semantic or lexical indicators that signal this. There are many challenges dealing with “explicit and implicit causal relations based on syntactic-structure-based causal patterns” (Paramita, 2016). This algorithm does not attempt to identify this kind of expression of cause-effect. Prior research in this area has shown limited promise to date (Mirza, 2016, p. 70).
Cause-effect is only one way to analyze. Differentiating (categorizing) and organizing (prioritizing, setting up a hierarchy) should also be addressed in future versions of this software. A student could compose a “richly” analytical piece without using cause-effect, although in this writer’s experience cause-effect is the most common expression in writing of people in this age group.
Analyzing a Corpus of Student Work
The New York State Education Department provides anchor papers for the Regents exams so that raters can have models of each possible essay score on a scale of one to five. Anchor papers are written by actual students during the field testing phase of the examination creation process. Sixty such anchor papers were selected for use in this study from collections of thematic and document-based essays available online at the New York State Education Department website archive (https://www.nysedregents.org/GlobalHistoryGeography/). Thirty came from papers identified as scoring level five and thirty scoring level two. Essays scoring five are exemplary and rare. Papers scoring two are “passing” and represent the most common score. Essays are provided online in PDF format. Each one was transformed to plain text using GoogleDrive’s OCR feature. Newline characters were removed as was any text not composed by a student (such as header information). This constitutes the corpus.
The computer program analyzed each sample and returned the following statistics: number of cause-effect sentences found in the sample, the count of unique words “spent” on cause-effect relationships in the whole text, the count of unique words in the entire text, the percentage of unique words spent on cause-effect, the seconds it took to process, text complexity as measured by the Flesch-Kincaid readability formula, and finally a figure that is termed the “analysis score” and is intended to be a measure of “richness” in analysis in the writing sample.
An interesting and somewhat surprising finding came in comparing the corpus of level two essays to those scoring a level five. There was no real difference in the percentage of unique words students writing at these levels spent “doing” analysis of cause-effect. The mean percent of words spent on cause-effect relative to the unique words in the entire text was 46% in level five essays and 45% in level twos. There were no outliers and the standard deviation for the level fives was 0.9; for the level twos it was 0.13. Initially, it seemed that essays of poor quality would have a much different figure, but this turned out not to be the case. What made these level two papers just passing was their length and limited factual content (recall that analysis is only one dimension on this rubric).
Text complexity is an important factor in evaluating student writing. The Flesch-Kincaid readability formula is one well-known method for calculating the grade level readability of a text. In an evaluation of the “richness” of a student’s use of analysis, text complexity is a significant and distinguishing feature. The “analysis score” is a figure intended to convey that combination of text complexity and words spent on cause-effect type analysis. This figure is calculated by multiplying the percentage of unique words spent on cause-effect by 100, and then multiplying by the grade level result of the Flesch-Kincaid formula. This measure yielded more differentiating results. In order to discover ranges of normal performance based on these models, the following statistics were calculated for each data set: lowest score (MIN), first quartile(Q1), median(MED), third quartile(Q3), and highest score(MAX).
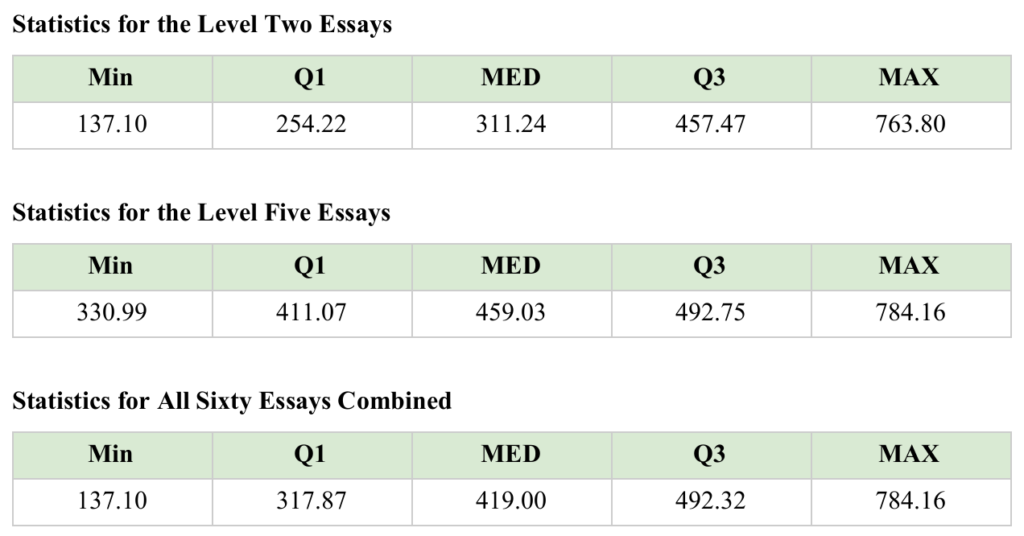
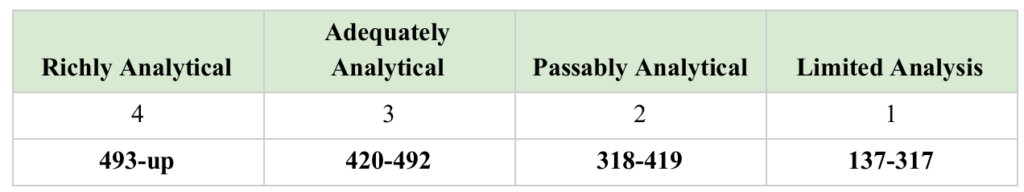
If this corpus of sixty essays can be considered representative, then the ranges can be considered standards in assessing the richness of secondary level student analysis in a writing sample. These figures can be used to devise a rubric. On a scale of one to four where four is the highest valued sample, the following ranges are derived from the combined statistics of all sixty essays:
Incorporation of Cause-Effect Assessment into AI-Assisted Grading
The artificially-intelligent grading assistance provided subscribers at InnovationAssessments.com, to date, estimates grades for student composition work based on a comparison of eleven text features of the student sample from a comparison with the most similar model answer in a corpus of one or more model texts. In cases where expository compositions are valued higher for being “analytically rich”, incorporating this cause-effect function could refine and enhance AI-assisted scoring.
Firstly, the algorithm will examine the most similar model in the corpus to the student sample. If the analysis score of the model text is greater than or equal to 419, then it is assumed analysis is a feature of the response’s value. In this case, an evaluation of the “analytical richness” of the student’s work will be incorporated into the scoring estimate. Samples that are more analytical will have greater chances of scoring well.
Conclusion
An artificially intelligent grading program for secondary student expository writing that includes an evaluation of the richness of analysis in that text would be very valuable. Cause-effect statements are indicators of analysis. The algorithm described here identifies and extracts these sentences, processes them for meaningful analysis, and judges the quality of the student’s analysis with a number which incorporates a measure of the proportion of words spent on analysis and text complexity. An analysis of sixty samples of student writing yielded a range of scores at four levels of quality for use in artificial grading schemes. While this algorithm does not detect all varieties of cause-effect relationships nor even all types of analysis, its incorporation in already established artificial scoring programs may well enhance the accuracy and reliability of the program.
Sources
Abrams, D. (2004). Revised Generic Scoring Rubrics for the Regents Examinations in Global History and Geography and United States History and Government (field memo). Retrieved from http://www.p12.nysed.gov/assessment/ss/hs/rubrics/revisedrubrichssocst.pdf .
Asghar, N. (May 2016). Automatic Extraction of Causal Relations fromNatural Language Texts: A Comprehensive Survey. Retrieved from https://arxiv.org/pdf/1605.07895.pdf.
Krathwohl, D. (2002). A Revision of Bloom’s Taxonomy: An Overview. Retrieved from https://www.depauw.edu/files/resources/krathwohl.pdf .
Mirza, Paramita. (2016). Extracting Temporal and Causal Relations between Events. 10.13140/RG.2.1.3713.5765 .
Sorgente, A., Vettigli G., & Mele F. (January 2013) Automatic extraction of cause-effect relations inNatural Language Text. Retrieved from http://ceur-ws.org/Vol-1109/paper4.pdf .