There was not a lot of math in my teacher preparation in the 1980s. Actually, I managed to take my BA without a math course (I took extra science instead). I sure wish I had statistics from the start!
Read this blog post on how it is done.
Sometimes no matter our experience or preliminary testing, we are surprised at how poorly a class does on a test. Most teachers resort, quite rightly, to some kind of “curve” to alter the scores. Even a valid, reliable test can be too difficult for students.
In effect, the standardized scoring was a useful set of training wheels that naturally disappeared once the class met the normal performance level!
A second issue of interest is in scaffolding difficult tasks for our students. Some things require time and practice to learn to do. Students may face low scores at first on such tasks. We don’t want their grades or their confidence to suffer. “Curving” the grades on a task while students are still in training for it is a good practice.
Enter the z-score standardization procedure. I don’t want this to be a post about mathematics (mostly because I am not confident to do so), but I would like to promote this as one of the best ways to alter a set of test scores in situations where (1) the group’s scores are lower than expected (say, more than 5 points below the class average overall in the course) or (2) the class is still practicing a difficult skill.
My interest in z-score began around 2010 when I was working to establish that the different capstone unit tasks I let kids choose were, in fact, of equal difficulty. I value differentiated instruction, but I also strongly value fairness. Z-score standardization let me establish how the rubrics for tasks in my class compared to a state test.
Standardizing the scores requires data that basically establishes a norm. How “should” the class have performed based on how a large set of previous students have performed? One of the things that makes grade standardizing hard is that one does not always have access to this data. How should my kids have done compared to how all my previous kids have done? Well, I saved my data.
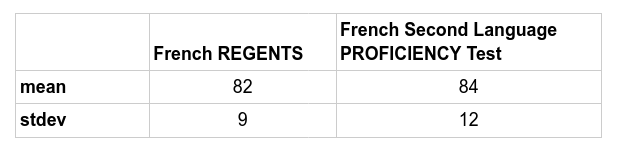
I taught French for the first thirteen years of my career (plus two years later on) and then the other eighteen years I taught social studies. Now, mind you, I’m not a person to save a lot of stuff. My classroom was always pretty bare and I threw out stuff I wasn’t using. But data, that’s something I like to save. I have hard copies of my final grade sheets for all my students from 1994 to 2013. I also have all my Regents results (for those of you not in new York State, “Regents” are standardized state tests in different subjects). Permit me to share my data with the reader. This data will give you the mean and standard deviation on population sizes of around 100 (between 92 and 100) for French grades 8-10 and for social studies grades 8-11. See below.
I learned to do this with the help of my colleague in the math department, to whom I am grateful for answering a lot of my questions over the years and helping me learn basic statistics. I am a computer programmer and I wrote an app to do the calculations. It’s available for free and I invite you to use it. Just enter your class’ test scores, then the mean and standard deviation of the standard test you’re standardizing the scores to. The app generates a table of standardized scores and some statistical information.
A good example of using this is when I was teaching Global Studies 10 and US History 11. The new New York State Regents exams in these subjects have stimulus-based multiple-choice questions. These are hard for students at first. I had them do one each unit as a test. Standardized scoring let me modify their scores so that their grades were not harmed and their confidence preserved. So here’s the beauty of the standardized scoring: the method sets the mean of the current task to that of the standard, then adjusts everyone’s score using standard deviations. As the class improved on this task month by month, the class average approached the standard mean, so the grades were affected less and less. In effect, the standardized scoring was a useful set of training wheels that naturally disappeared once the class met the normal performance level!
A number of my education courses back in the ’80s were kind of useless. Hopefully, teacher training is better today. (I only had a one credit course in behavior management theory! Sheesh!) Statistics would have been a good course for me because I used it so extensively in my career. Readers who are interested might subscribe to InnovationAssessments.com to see the other statistical apps that you might find useful.